
Social Listening KPIs: Which Metrics Actually Matter for Your Brand
- Sanket Maheshwari
- 4 hours ago
- 10 min read

The brand manager sends the monthly social listening report to the marketing director. Mention volume up 18%. Reach up 23%. 14,000 comments across brand posts and tagged creator content.
The marketing director replies with one question: "Is the brand in a better position than it was last month?"
She does not know how to answer that from the numbers in the report.
And that is the problem. Mention volume and reach to convey how visible the brand was.
They say nothing about whether that visibility is building trust, eroding it, or doing nothing. The social listening KPIs that actually matter are the ones that answer the question she got asked.
Social data vs social listening KPI
Brands collect plenty of social media metrics every day, but not all of them are useful for decision-making. That's the difference between data and a KPI.
Social data simply tells you what happened. It could be the number of mentions, views, or followers your brand has. It's helpful for tracking activity, but it doesn't always tell you what to do next.
A KPI goes a step further. It shows whether you're moving in the right direction, how you're performing against competitors, and whether your strategy is working.
A simple way to tell the difference is to ask yourself: "If this number changes, would I change my next move?" If the answer is no, it's just data, not a KPI.
The eight metrics below are the ones that can genuinely guide your strategy.
KPI 1: Brand Sentiment Score
What it measures: The overall emotional tone of conversations about the brand across all monitored platforms, broken into positive, negative, and neutral.
What it tells the brand: Whether audience perception is improving, deteriorating, or stable. A brand with high mention volume and declining positive sentiment is growing its reach while losing its reputation.
What a shift means: A steady drop in positive sentiment is usually a sign that something needs attention before it becomes a bigger problem. If negative sentiment suddenly jumps on a particular day, there's often a clear reason behind it. It could be a creator's post that didn't go down well, a product issue, or people comparing the brand with a competitor. The KPI tells you that something changed, while comment analysis helps you understand what caused it.
How CultureX tracks it: CultureX’s Track.social's AI comment classification tags every comment across connected brand accounts as positive, neutral, or negative, and then goes a step further by identifying the type of negative sentiment: product feedback, service complaints, or brand comparisons. So the brand can see not just that sentiment dropped, but whether it dropped because of a product quality concern or a service failure. The Hashtag Analyser tracks campaign-level sentiment separately from brand-level sentiment, so a rough campaign does not distort the overall brand picture.

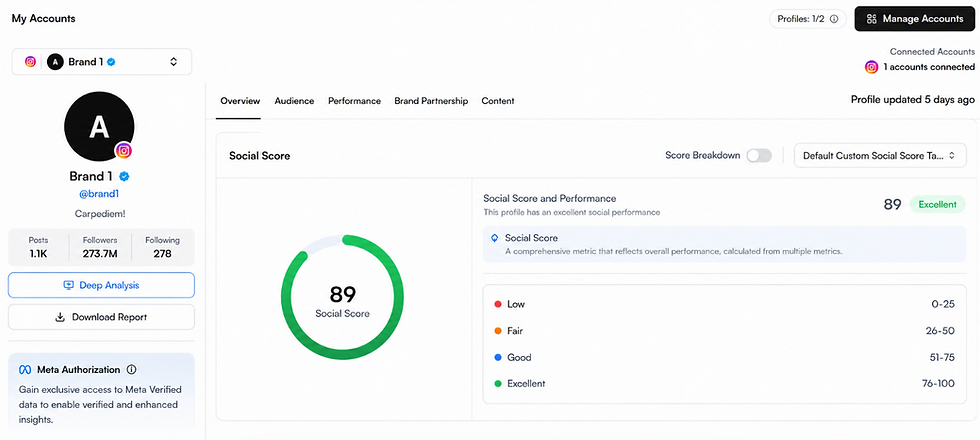
KPI 2: Social Score
What it measures: Social Score combines signals such as engagement quality, audience authenticity, follower growth, and content relevance into a single score that reflects overall social health.
What it tells the brand: Whether the brand's overall social presence is becoming more or less credible over time. Engagement rate alone can spike or crash based on one viral post. Social Score reflects the underlying trajectory, not individual post performance.
What a shift means:A lower score with rising followers can mean the audience is growing, but the content isn't getting meaningful interactions from the right people. On the other hand, a higher score with little change in follower count suggests that the existing audience is engaging more genuinely, which is usually a better sign for long-term growth.
How CultureX tracks it: Every brand account on Track.social has a Social Score in the dashboard that is continuously updated. The same score is available per competitor through Listenings.ai's Market Benchmark and Competitive Watch, so the brand can track its Social Score trajectory against competitors directly rather than in isolation.
KPI 3: Share of Voice
What it measures: Share of Voice tells you how much of the social conversation in your industry is about your brand compared to other brands. It is calculated using engagement, views, and content activity across all tracked competitors.
What it tells the brand: Whether the brand is gaining or losing ground in the category conversation relative to competitors. Growing followers but declining share of voice means the brand is growing more slowly than the category. Stable followers, but a rising share of voice means the brand is outperforming competitors in engagement quality.
What a shift means: A declining share of voice often comes before a drop in purchase consideration. Competitors are owning more of the audience's attention even when the brand's own numbers look fine.
How CultureX tracks it: CultureX’s Listenings.ai Market Benchmark compares your brand with up to 10 competitors simultaneously. It tracks views, engagement, Social Scores, and content volume, while the six-month follower growth comparison helps you see how your Share of Voice changes over time.
A perfect fix: instead of pulling competitor data manually from four separate accounts and building a comparison in a spreadsheet, the brand manager opens Market Benchmark and sees the relative position updated automatically.

KPI 4: Sentiment by Content Type
What it measures: This examines how people respond to different kinds of content, whether it's a tutorial, a product review, an unboxing video, or a lifestyle post. The goal is to see if one format gets a better response than another.
What it tells the brand: Which content types are building positive brand association and which are generating criticism or indifference. A brand running multiple content formats needs to know which ones are actually working, not just which ones rack up the most views.
What a shift means: If educational content regularly receives better feedback than promotional posts, it's a clear signal to focus more on that format in future campaigns. These insights can help improve content planning and campaign performance.
How CultureX tracks it: CultureX’s Track.social's AI Smart Labels categorise brand content automatically into themes: product promotion, tutorials, influencer partnerships, community engagement, and brand story. Combined with comment classification, the platform shows which content category is generating which type of engagement. The AI Brand Strategizer can also be asked directly, "Which content type generated the most positive comments this month?" and will return an answer based on the actual data.

See how CultureX tracks brand sentiment, Social Score, share of voice, and campaign hashtag performance in one dashboard. Explore the platform.
KPI 5: Comment Classification Breakdown
What it measures: The distribution of comment types across the brand's posts: product feedback, service complaints, purchase intent signals, brand comparisons, and general brand mentions.
What it tells the brand: Not every comment means the same thing. This KPI helps brands understand what people are actually saying. Some comments show interest in buying, some highlight customer service problems, while others compare the brand with competitors.
What a shift means: A change in comment trends is often an early signal that something is changing. More purchase-related questions suggest a growing interest in the product. An increase in complaints may highlight service or operational issues, while more competitor mentions can indicate rising competition in the market. Looking beyond the numbers helps brands identify the real issue and act quickly.
How CultureX tracks it: CultureX’s Track.social's AI comment classification runs automatically across all connected accounts, tagging every comment by type. The brand manager filters by comment type rather than reading through everything. Purchase intent gets flagged for sales. Service complaints get flagged for customer support. Brand comparisons go to the strategy team.

KPI 6: Competitor Sentiment Gap
What it measures: The difference between the brand's sentiment score and a direct competitor's sentiment score over the same period.
What it tells the brand: It gives you a clear picture of who has the stronger public perception. If your brand is ahead, it's an advantage worth protecting. If a competitor is ahead, it's a chance to understand why.
What a shift means: When the gap becomes smaller because the competitor is gaining more positive sentiment, it can be an early signal to pay attention. Even if your own sentiment hasn't dropped, the market may be responding better to someone else.
How CultureX tracks it:CultureX’s Listenings.ai Competitive Watch provides a 1-vs-1 deep comparison between the brand and a chosen competitor. The Comments Radar shows sentiment analysis on competitor post comment sections: positive, neutral, and negative breakdown of how a competitor's audience is actually responding to their content, not just how the posts are performing on surface metrics.

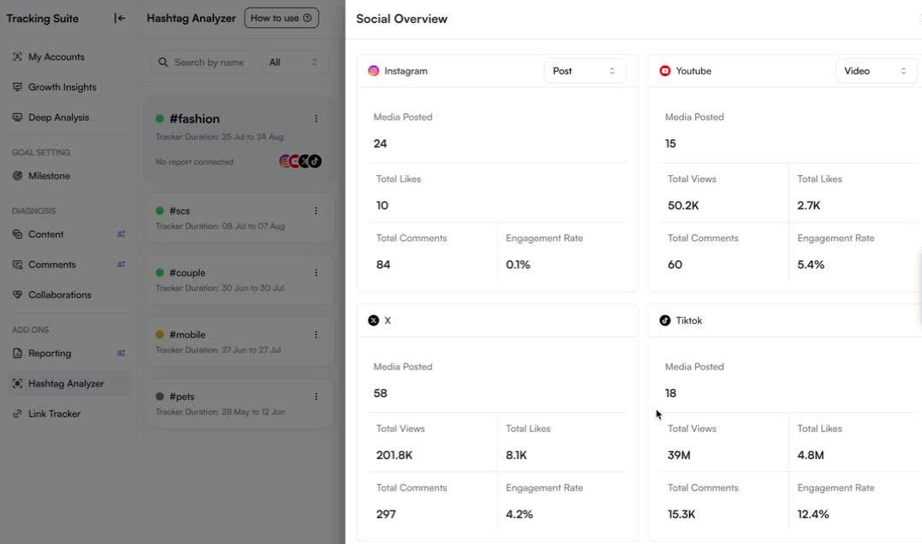
KPI 7: Campaign Hashtag Sentiment and Volume
What it measures:This tracks how many people are using your campaign hashtag and whether the conversations around it are mostly positive, negative, or neutral while the campaign is still running.
What it tells the brand: Whether a live campaign is building positive momentum or quietly generating complaints. A campaign hashtag with high volume and declining positive sentiment is producing noise, not brand value.
What a shift means: A sudden rise in negative sentiment during the campaign is an early warning sign. The brand can address the issue, update its approach, or take action before the situation worsens. Without monitoring it in real time, the opportunity to respond may be missed.
How CultureX tracks it: CultureX’s Track.social's Hashtag Analyser tracks campaign hashtags across Instagram, YouTube and TikTok simultaneously. Volume and sentiment update continuously rather than in daily batches. Posts are sortable by views, engagement rate, comments, follower count, or recency. Sentiment status indicates whether the hashtag conversation is trending positively, neutrally, or negatively at any point during the campaign.
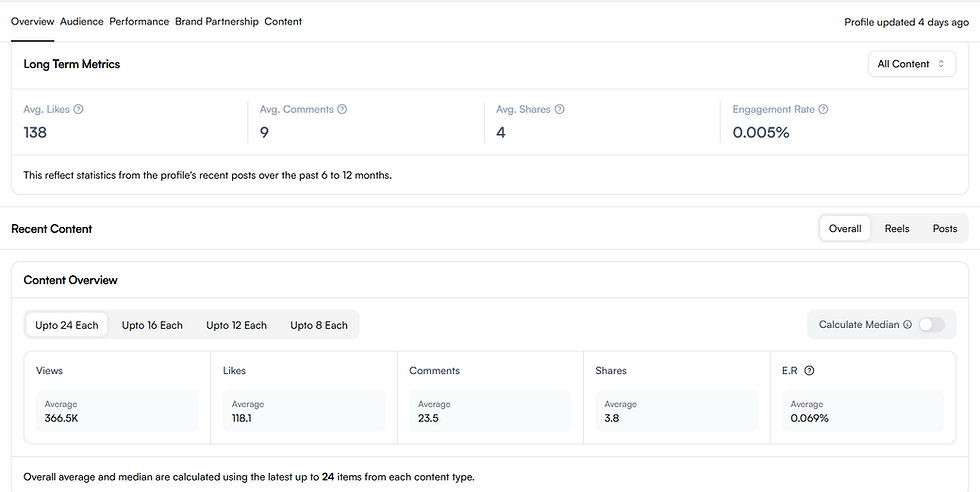
KPI 8: Optimal Content Timing Performance
What it measures: The engagement and reach performance of content published at different times and on different days, analysed across a meaningful post history.
What it tells the brand: When the audience is most active and responsive. Publishing good content at the wrong time wastes the production budget spent making it.
What a shift means: Audience behaviour changes. A posting schedule built on data from six months ago may be misaligned with what the audience is doing now. Checking this quarterly keeps the strategy up to date.
How CultureX tracks it: CultureX’s Track.social's Growth Insights analyses posting patterns and content performance across every time slot and day of the week, visualised in a Performance Heatmap. Best days to post, best time windows, median reach by time slot, and average posts per day are all visible from the brand's own historical data. Not a general industry benchmark. The brand's own audience tells it when to show up.

How to present these KPIs to leadership
Having the data is one thing. Explaining why it matters is what gets leadership to pay attention.
Here are three simple ways to make your KPIs more meaningful:
Start with the story, not the statistic. Instead of saying, "Positive sentiment is 68%," explain what's happening. For example, "Positive sentiment has fallen by 8 points in the last four weeks, mainly because of complaints about product quality." That's something people can act on.
Connect every KPI to a business decision. Every KPI should lead to a clear action. If the share of voice is down by 4 points compared to last month, use that insight to shape the next campaign. Adding more creator content could help bring back category visibility. Numbers on their own don't add much value unless they help drive decisions.
Always add context. A sentiment score by itself doesn't say much. But if your brand is scoring 12 points higher than its closest competitor, the picture becomes much clearer. Comparing your numbers with the market makes them easier to understand.
CultureX consolidates all eight social listening KPIs into a single dashboard that updates daily. Since it can be shared through a secure link, brand managers can simply send the live dashboard to leadership instead of spending hours putting together a presentation.
Six signs the current KPI framework is not driving decisions
The monthly report is presented, but does not change any campaign or content decisions the following month.
The team tracks mention volume and reach, but cannot tell leadership whether brand sentiment is improving or declining.
There is no structured view of how the brand's social performance compares to two or three direct competitors.
Campaign performance is reviewed in aggregate rather than by content type, so the brand cannot identify which formats generate positive sentiment versus complaints.
Shifts in audience sentiment get discovered through individual comments rather than through a dashboard that surfaces patterns.
Posting schedules are based on general platform advice rather than the brand's own historical engagement data.
Mention volume and reach have their place. They are not a decision-making framework.
The brands getting the most from social listening treat it as a strategic input into campaign planning, content strategy, and competitive positioning. Not a monitoring function that produces a report nobody acts on.
Ready to track social listening KPIs that actually drive decisions? Start your free trial on CultureX.
FAQs
What are social listening KPIs?
Metrics that tell a brand whether its social strategy is working, not just how much activity is happening. Mention volume and reach are data. A KPI is a number that changes in a way that tells the brand what to do differently. Brand Sentiment Score, Social Score, Share of Voice, and Campaign Hashtag Sentiment all pass that test. Raw follower counts and post reach usually do not.
Which social listening KPIs should brands track?
There are plenty of social metrics out there, but only a handful are truly useful for decision-making. The ones worth tracking are Brand Sentiment Score, Social Score, Share of Voice, Sentiment by Content Type, Comment Classification Breakdown, Competitor Sentiment Gap, Campaign Hashtag Sentiment and Volume, and Optimal Content Timing Performance. The key is that every KPI should help you decide what to do next. If it doesn't influence an action, it's just another number on a dashboard.
What is the share of voice in social media, and how do I calculate it?
The brand's share of total engagement or content volume in its category compared to competitors. If the brand generates 40% of total views across five competitors in the category, its share of voice is 40%. A declining share of voice while followers grow indicates the brand is growing more slowly than the category. CultureX's Listenings.ai Market Benchmark calculates this automatically across up to 10 competitors without manual data pulling.
How do I measure brand sentiment as a KPI?
The easiest way is to monitor how many mentions and comments are positive, negative, or neutral over time. The trend matters much more than a single day's result. It's also important to understand what's causing the negative sentiment, whether it's product issues, customer service, or comparisons with competitors. CultureX's Track.social AI automatically groups these comments, making it easier to spot the real reason behind a sentiment shift.
What is Social Score, and how is it used as a KPI?
Social Score is an overall measure of a brand's social presence. It looks at engagement quality, audience authenticity, growth patterns, and content relevance together. Since it isn't affected by one unusually good or bad post, it offers a more reliable view of long-term performance. Brands can use it to monitor themselves and compare against competitors.
How do I track campaign performance through social listening KPIs?
Through campaign hashtag sentiment and volume tracked in real time across all platforms. CultureX's Hashtag Analyser tracks campaign hashtags across Instagram, YouTube, TikTok, and X simultaneously, with volume and sentiment continuously updated rather than in daily batches. A negative sentiment spike surfaces in the dashboard during the campaign window, not in a post-campaign report.
How do I present social listening KPIs to senior leadership?
The best way to present KPIs is to explain what changed and what the business should do next. Compare results with earlier performance, competitors, or industry benchmarks, and connect each metric to a clear recommendation. That's much more useful than simply showing a chart full of numbers.
How does CultureX help brands track social listening KPIs?
Track.social covers Brand Sentiment Score, Social Score, Sentiment by Content Type, Comment Classification Breakdown, Campaign Hashtag Sentiment, and Optimal Content Timing through AI comment classification, AI Smart Labels, the Hashtag Analyzer, Growth Insights, and the Performance Heatmap. Listenings.ai covers Share of Voice and Competitor Sentiment Gap through Market Benchmark, Competitive Watch, and Comments Radar. All eight KPIs are visible in one shareable dashboard without manual data compilation.


Comments